To enhance the ease of use of the feature-rich and power-efficient STM32 family of microcontrollers, in 2019 ST has added a free, multifunctional STM32 development tool to the STM32Cube software ecosystem: the STM32CubeIDE.
To work as well as commercial integrated development environment (IDE) tools, STM32CubeIDE takes full advantage of the technology of Atollic®, an embedded development tool vendor acquired by STMicroelectronics in 2017. Using industry-standard open licensing terms, this IDE software adds STM32-specific features for simplifying and accelerating STM32-based embedded designs, including powerful STM32CubeMX microcontroller configuration and project management tools.
By integrating STM32CubeMX with STM32CubeIDE, ST has created a more powerful development environment. the complete STM32Cube ecosystem also includes the STM32CubeProgrammer code burner and the STM32CubeMonitor family of code run monitors, as well as numerous standalone MCU firmware packages.
What is STM32CubeIDE?
STM32CubeIDE is an official free software development tool from ST, based on the Eclipse®/CDT framework, the GCC compilation tool chain and the GDB debugging tool, and supports adding third-party functional plug-ins. At the same time, STM32CubeIDE integrates some of the STM32CubeMX and STM32CubeProgrammer features.
With STM32CubeIDE, developers can do everything from chip selection, project configuration, code generation, to code editing, compiling, debugging and burning.
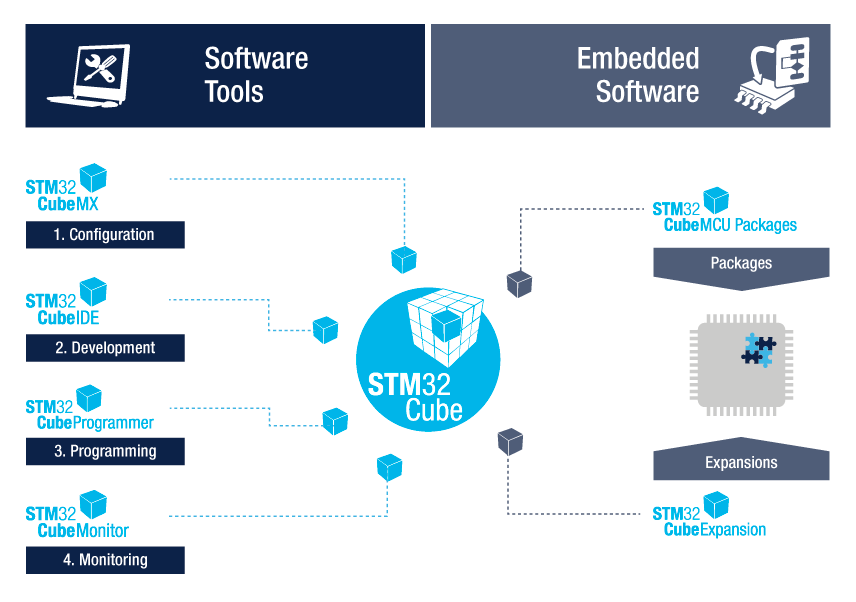
STM32CubeIDE Features
1. Integrate STM32CubeMX:
- STM32 microcontroller selection
- Pin assignments, clocks, IP and middleware configuration
- Project creation and initialization code generation
2. Based on Eclipse/CDT, support Eclipse plug-ins, use ARM tool chain and GDB debugger in GNU C/C++.
3. Other advanced debugging functions:
- CPU cores, IP registers and memory views
- Live variable watch view
- System Analysis and Live Tracking (SWV)
- CPU fault analysis tool
4. Support ST-LINK and J-Link debug probe
5. Support importing projects from TrueSTUDIO and AC6 (SW4STM32)
6. Support operating system: Windows, Linux and MacOS
STM32CubeIDE Download
Here’is the offical download link:
https://www.stmicroelectronics.com.cn/en/development-tools/stm32cubeide.html
STM32CubeIDE Workspace
STM32CubeIDE is an Eclipse-based framework that inherits some of the features of Eclipse that are not familiar to users, such as perspective views, workspaces, etc.
Workspace: STM32CubeIDE manages projects through workspace. When opening STM32Cube, it creates a new default workspace. The new or imported project will belong to this workspace. The projects under the same workspace have the same IDE-level configuration (set in Window→Preferences), such as the display and editing style settings. From the file system point of view, a workspace is a folder that contains multiple project folders and a folder named “.metadata”, which contains information about all the projects in that workspace. metadata” folder contains information about all the projects in the workspace. The “.metadata” folder contains the information of all the projects in the workspace. The user can switch between workspaces via File→Switch Workspace menu.
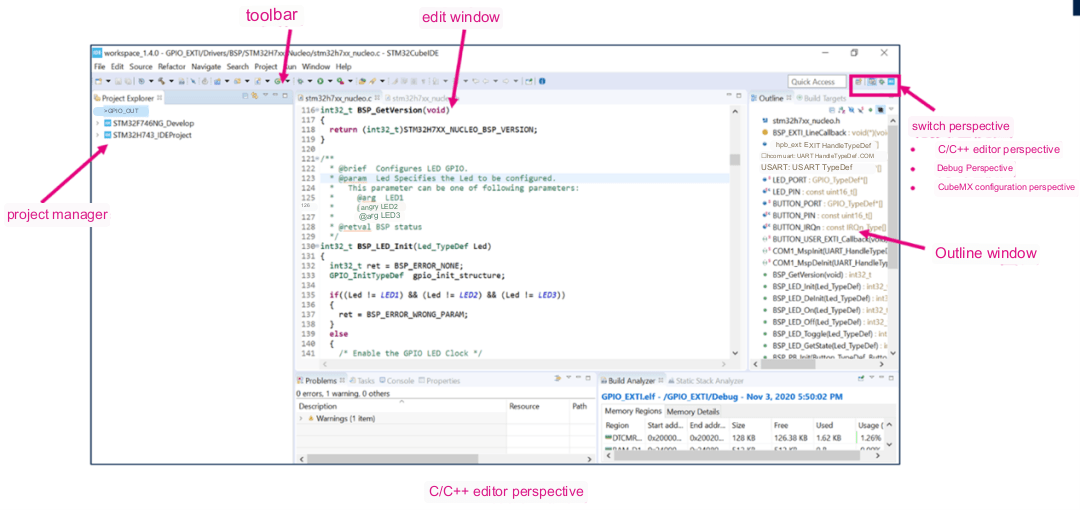
Perspective: A perspective is a series of windows related to a certain type of function. Commonly used are C/C++ Edit Perspective, Debug Perspective and CubeMX Configuration Perspective.
The C/C++ Edit Perspective includes the Project Manager, Edit Window, Outline Window, and so on. The Project Manager allows you to view and manipulate all projects in the current workspace. Double-click to open a file in the project, and the file contents will be displayed in the Edit window, where you can edit it. The rightmost Outline window lists all functions, variables and macros defined in the currently opened file.
The Window Show View menu allows you to open and close the windows that need to be displayed in the C/C++ editing perspective.
You can switch between different perspective views by using the icons on the top right, for example, by clicking on the crawler icon, you can switch to the debug perspective view. Clicking the Debug button in the toolbar under the C/C++ Edit Perspective view will also automatically switch to the Debug Perspective view after starting debugging.
How to Use STM32CubeIDE?
1. Project Management
Create A New Project
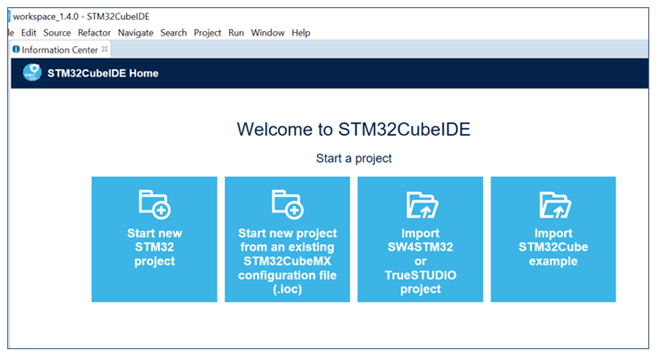
Using STM32CubeIDE, users can start a new project in a variety of ways. The welcome screen of STM32CubeIDE lists the shortcut entry points for creating/importing a project, corresponding to the four scenarios below. The corresponding functions can also be implemented through New and Import under the File menu.
- Create a new STM32 project from scratch
- There is already an STM32CubeMX configuration file (*.ioc file ), and you want to create a new STM32 project based on this ioc file.
- I already have a SW4STM32 or TrueSTUDIO project and want to convert it to a STM32CubeIDE project.
- Create a new project based on the routines in the STM32Cube library
STM32CubeIDE Project Structure
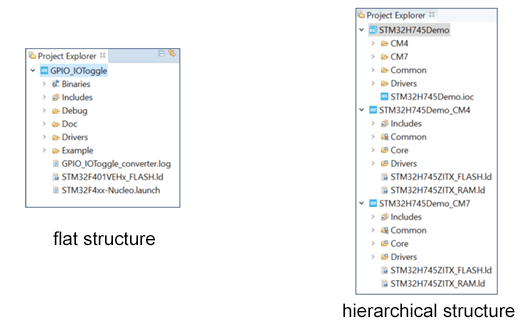
STM32CubeIDE has two project structures, as shown in the following figure.
The single-core MCUs are flat structures.
For dual-core architecture MCUs or security MCUs, such as STM32H7, STM32L5 and STM32MP1 series, the STM32CubeIDE project is a hierarchical structure. Take STM32H7 as an example, after creating or importing an STM32H7 project, you will see a three-layer project structure in the Project Explorer bar: the top layer is the “root” project, then there are two “child” projects corresponding to CM7 and CM4 cores respectively. The top layer is the “root” project, then there are two “sub” projects corresponding to the CM7 and CM4 kernels, and the project files are under the “sub” projects. These two CM7 and CM4 “sub” projects are the real compilable and debuggable projects, while the “root” project is just a “container” that contains the CM7 and CM4 “sub” projects. AN5361, AN5394, AN5360 and AN5564 describe how to create, import, compile and debug STM32H7 dual-core, STM32L5, STM32MP1 and STM32WL projects respectively in STM32CubeIDE.
Firmware Library Management
STM32CubeIDE integrates some of the STM32CubeMX features, allowing you to generate a new project by directly selecting the chip/development board model or by selecting a routine. the driver and routine code needed to generate a project with STM32CubeIDE comes from the firmware libraries of each STM32 family.
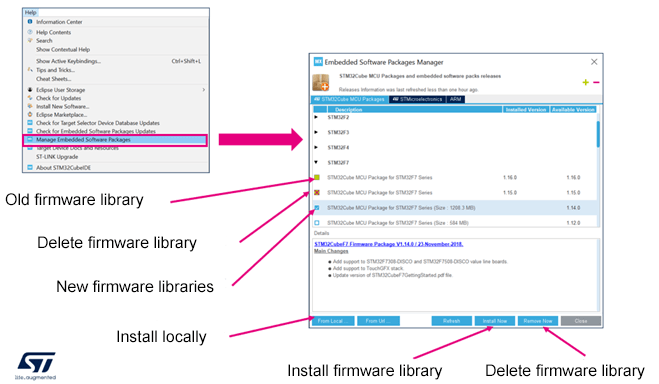
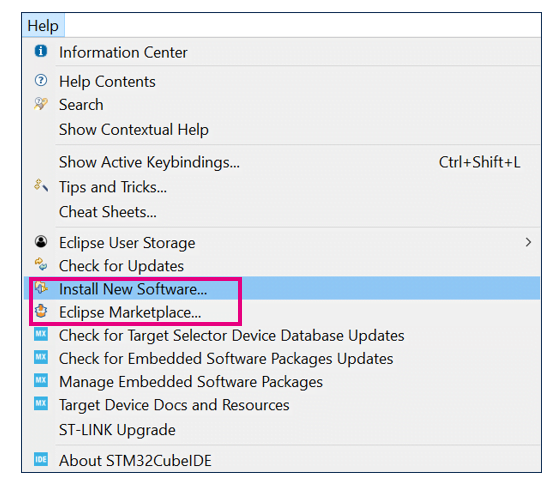
In Help→Manage Embedded Software Packages, all STM32 firmware libraries and other plug-ins can be managed (install/remove firmware libraries).
The Install Now button allows the STM32CubeIDE to automatically download and install from the network, and the From Local button allows you to install pre-downloaded firmware libraries.
The Remove Now button allows you to remove the selected firmware library.
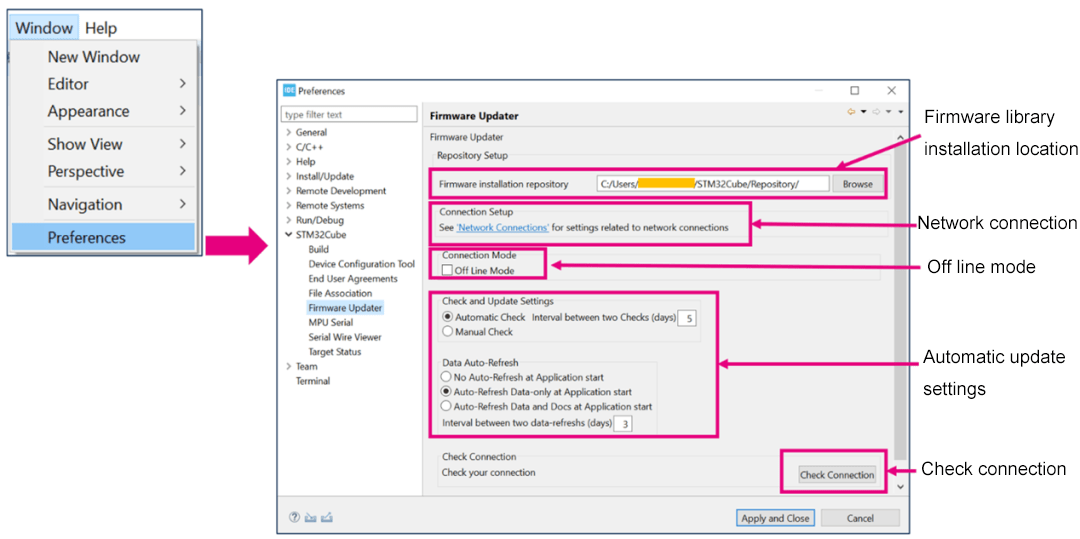
Under the STM32Cube Firmware Updater tab in the Window Preferences window, you can set the path to the firmware library installation and how to update it.
Network Configuration
By default, STM3CubeIDE will try to connect to the network when opening and creating a new project. You can also choose “Off Line Mode” to prevent STM32CubeIDE from connecting to the network. However, you need to install the pre-downloaded firmware libraries through the From Local button in the Embedded Software Packages Manager window in the previous picture, otherwise the code will not be generated automatically for the new STM32 project.
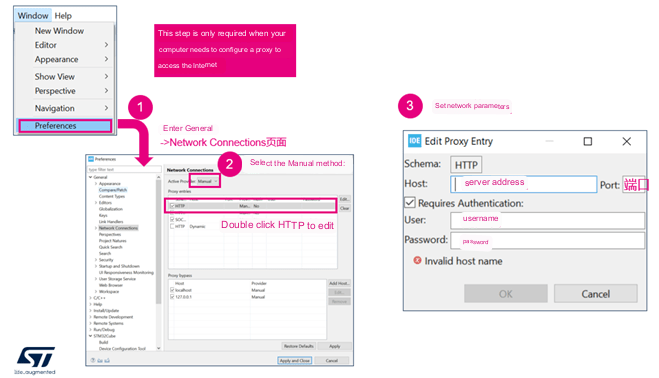
Click the Check Connection button to check the current network connection status. If a red x appears at the end of the check, it means that there is a problem with the network configuration and we need to go to the Network Connection page to set it.
In addition to the previous active network status detection, if the firmware download fails, please also check whether the network configuration of STM32CubeIDE is correct.
The configuration steps are shown in the following figure:
1. Go to Window Preferences menu and select the General Network Connections tab
2. Select Manual method
3. Select HTTP and double click to open the edit window to set the network connection parameters.
Open/Close/Delete/Switch/Export STM32CubeIDE projects
In the Project Explorer window, you can see all the projects under the current workspace. Users can open/close/delete/import/export/rename any project in this window.
2. Code Compiling
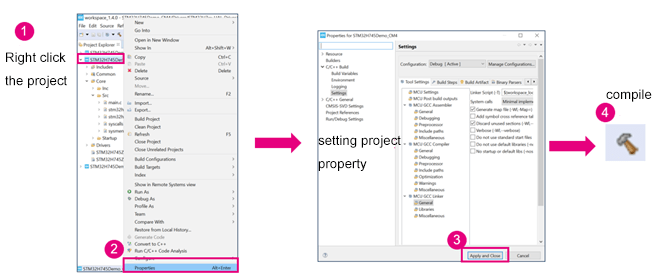
Properties Setting and Compilation
Select a project in the Project Explorer, right-click it and enter the properties menu, where you can configure the compilation items.
Once the configuration is complete, the project is ready to be compiled. You can start the compilation in three ways:
– Method 1: Select the project, right-click on it, and select “Build Project”.
– Method 2: Select the project, enter it from the Project menu, and then select “Build Project”.
– Method 3: Select the project and click on the Build icon in the toolbar
Improve Compilation Speed
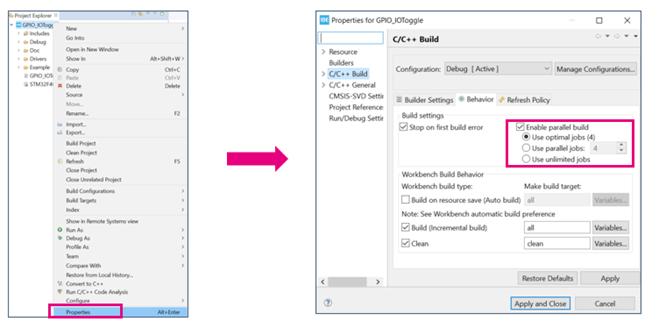
By enabling parallel build, you can improve the compilation speed of STM32Cube IDE.
Select the project, right click on it and enter the properties menu, select “C/C++ Build”, and under the Behavior tab, check the “Enable parallel build” feature.
Auxiliary Tools for Compilation
After the project is compiled, the “Build Analyzer” window shows the usage of all the memory regions and sections defined in the link file, including the load address, run address, how many bytes are occupied, how many bytes are left, etc. etc.
The “Static Stack Analyzer” window shows the usage of the static stack.
STM32CubeIDE also provides a Headless Build feature, which allows you to compile from the command line without opening the CubeIDE GUI.
3. Code Debugging and Burning
Debug and Run Configuration
After the STM32CubeIDE project has been compiled without any errors, it is ready for debugging and downloading.
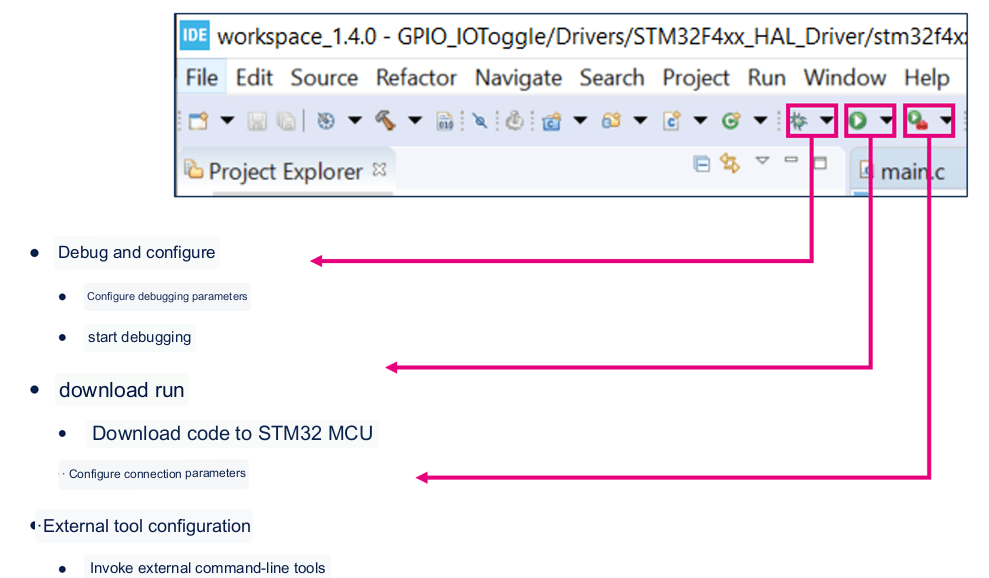
In the toolbar of the C/C++ Perspective there are three buttons related to downloading and debugging: Debug, Run and External Tools.
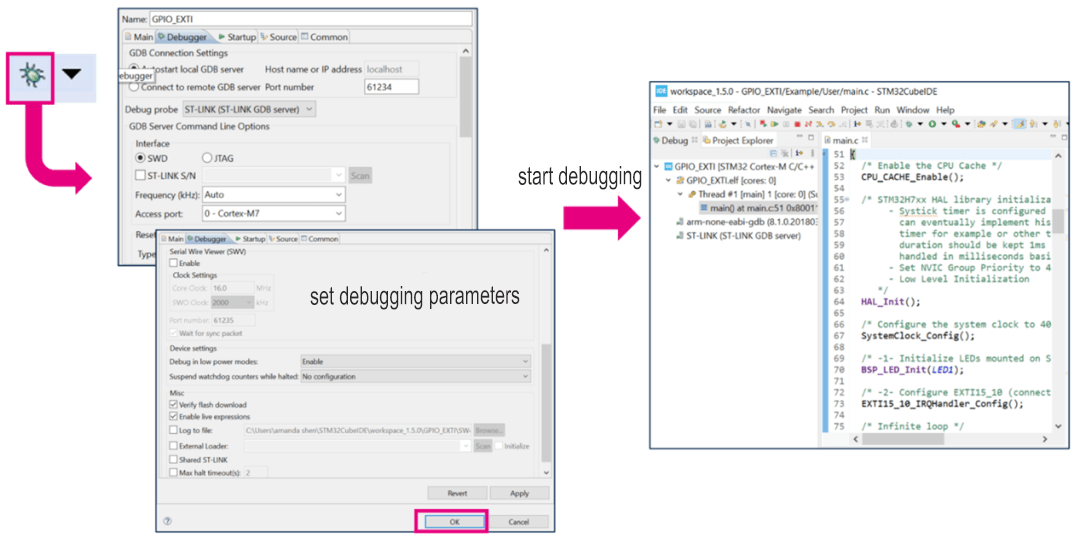
The small triangle next to the “Debug” button opens the Debug Configurations menu to configure debugging parameters, such as debugger selection, GDB connection settings, ST-LINK settings, external Flash Loader settings, etc., and to start debugging.
With the “Run” button, you can download the program only without starting debugging.
The “External Tools” button allows you to invoke external command line tools.
Start Debugging
STM32CubeIDE uses GDB for debugging, supports STLink and SEGGER J-Link debuggers, and supports connecting to the target MCU via SWD or JTAG interface.
After the STM32CubeIDE project has been compiled, debugging can be started directly by clicking on the crawler icon in the toolbar or by selecting the menu Run–>Debug.
If it is the first time to debug the current project, STM32CubeIDE will first compile the project and then open the debug configuration window. The debug configuration window contains options for debug interface selection, STLink settings, reset settings and external flash loader settings, etc. Users can check or modify the configurations. After confirming that all the configurations are correct, you can click OK to start debugging.
Then STM32CubeIDE will download the program to MCU first, and then start the execution from the program entry specified in the link file (*.ld). The program starts execution from Reset_Handler by default and pauses at the first line of the main function, waiting for the next debug instruction.
STM32CubeIDE Programming Example
Let’s experience the process of software development using STM32CubeIDE through an LED flashing light routine.
The routine uses the NUCLEO-H743ZI development board and creates a new project from scratch via STM32CubeIDE. The project then implements a simple function: the on-board LED1 flips automatically at 500ms intervals.
What we can learn from this programming example are as below:
- Create a new STM32CubeIDE project
- Configure the STM32 chip
- Add user code and compile
- Set debug parameters
- Debug code (view variables and registers)
- Set breakpoints
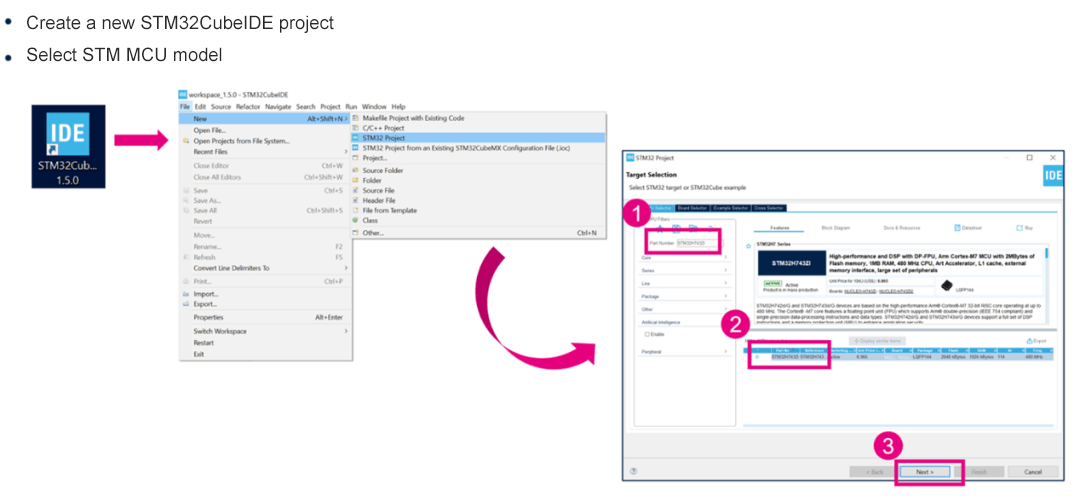
First, select File–>New–>STM32 Project, STM32CubeIDE will open the MCU selection window. Under this window, you can select a certain model of chip, or you can select a certain ST development board or routine. Here we type STM32H743ZI in the search box, you can directly select this chip, and then click Next.
In the next pop-up window, you need to set the project name, type and location to save the project. By default, the new project will be saved in the current workspace, but you can also uncheck “Use default location” and customize the location of the project as shown below. Note that if you try to put two projects under the same path, you may get an error during the creation process later. So you can add the project name to the path to distinguish different projects.
After the setup is done, click Finish and STM32CubeIDE will create a project for us and open the configuration interface of the chip, which is the same as STM32CubeMX.
During this time, you may get a popup that you will open the CubeMX configuration perspective, click Yes and you are done.
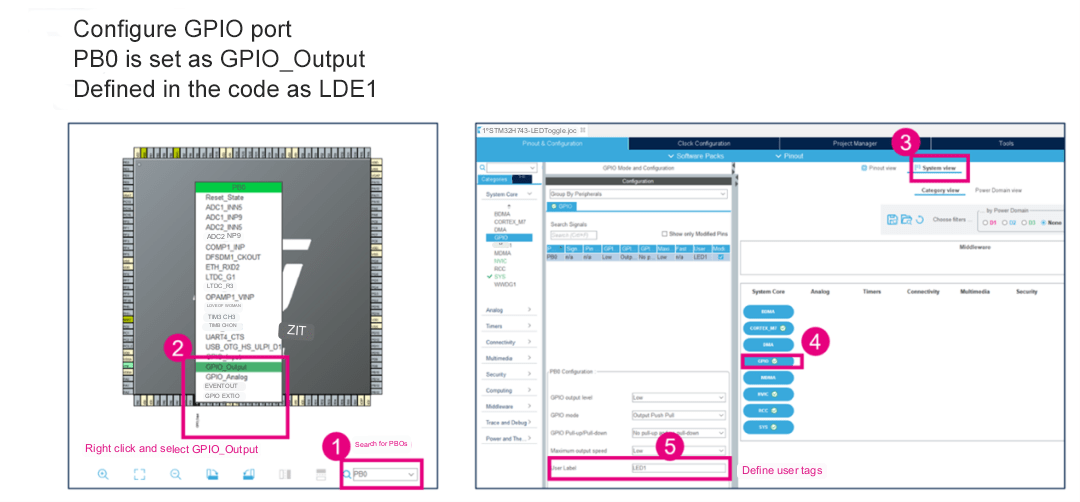
The next thing to do is to configure the clock, GPIO, peripherals, middleware, etc. as per functional requirements in the chip configuration screen. In this routine, we only use PB0, which is used as an output to control LED1, so we just need to configure it. The clock just uses the default configuration.
Under Pinout view, the pin to be configured can be found quickly on the chip package diagram by using the search bar.
Select the pin, right-click on it and select the GPIO_Output function.
Then go to System view, click on the GPIO module, and then you can see the PB0 pin you just configured. This window also allows you to continue adjusting other parameters of PB0, such as pull-up/down, speed, etc. It is also possible to define a user label LDE1 for it, which is easy to reference in the code.
After all the configuration is done, select Project–>Generate Code to regenerate the code. At this point the STM32Cube switches to the C/C++ perspective view and then you can add the user’s file or make changes to a C file.
Here, we add a piece of code that flips PB0. Note that all user-added code must be placed between the “USER CODE BEGIN xxx” and “USER CODE END xxx” declarations. This way, when the code is re-generated again, this part of the code will not be lost.
After the code is added, click “Build” to start compiling.
If the compilation is finished and there are no errors reported. Then you can click Debug to start debugging.
The first time you start debugging, a debug parameters configuration window will pop up, make sure all the parameters are correct, click OK, and STM32CubeIDE will automatically switch from edit interface to debug interface. As shown in the figure below.
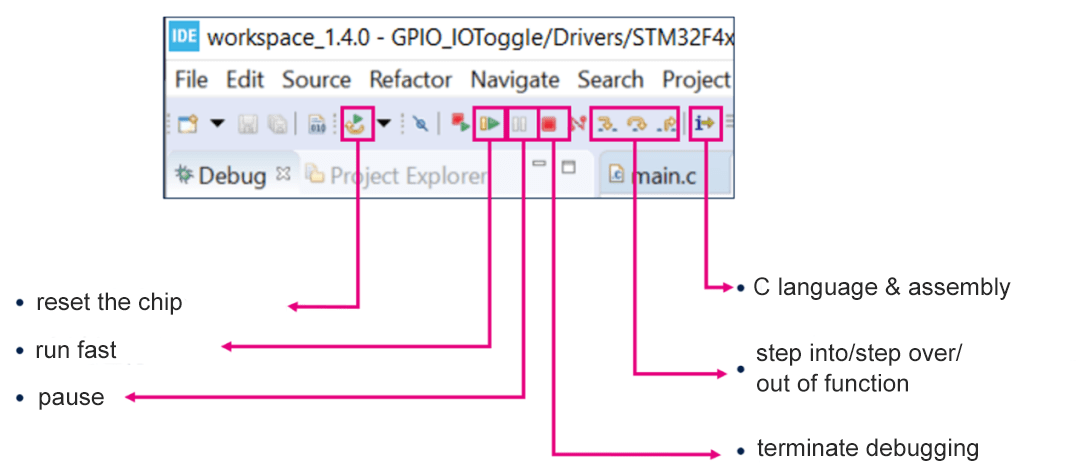
In the debug interface, you can debug in a single step by using the action buttons in the toolbar.
Double click on the leftmost marker bar of a line of code to add a breakpoint at this line of code.
Several debugging windows are opened on the right side, including: local variables, breakpoints, global variables and registers, etc. These windows can be opened or closed in Window–>Show View menu.
STM32CubeIDE vs STM32CubeMX
STM32Cube IDE is an Integrated Development Environment (IDE) for developing applications on STM32 microcontrollers. Based on the Eclipse platform, STM32Cube IDE integrates STM32CubeMX, debuggers, editors, compilers, and other tools, providing developers with a comprehensive environment. STM32Cube IDE offers debugging capabilities, version control, code editing, and build features, allowing developers to complete the entire development process within a unified interface.
STM32CubeMX is a graphical configuration tool designed to initialize STM32 microcontrollers and generate initialization code. It provides an intuitive interface allowing users to select microcontroller models, configure peripherals, pin mappings, and generate corresponding initialization code. STM32CubeMX can also generate FreeRTOS configuration files, configure the clock tree, and set interrupt priorities. The generated code can be integrated into various Integrated Development Environments (IDEs) such as Keil or IAR for further application development.
| Feature | STM32CubeMX | STM32Cube IDE |
|---|---|---|
| Purpose | Configuration tool for STM32 MCUs | Full IDE for application development |
| Functionality | Initializes MCUs, configures peripherals, generates code | Code writing, debugging, building, and compiling |
| Platform | Standalone, integrates with Keil, IAR | Built on Eclipse, integrates CubeMX, debugging tools |
| Code Generation | Generates initialization code for external IDEs | Develops and compiles applications directly |
| User Interface | Graphical interface for configuration | Full IDE with editing and debugging tools |
| Use Case | Set up peripherals and generate base code | Write, build, and debug applications |
Common Questions about STM32CubeIDE
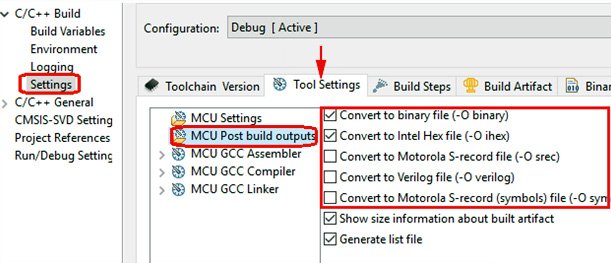
Can STM32CubeIDE generate BIN or HEX files after compilation?
By default, STM32CubeIDE generates ELF files after compilation. However, it also supports generating HEX or BIN files. The configuration process is as follows: Go to the main menu Project > Properties > C/C++ Build, and open the settings where you can configure the output format.
Does it support integration with the STM32CubeMX?
Yes, absolutely. STM32CubeIDE actually integrates STM32CubeMX as a module within its development environment. When creating a new project in CubeIDE, STM32CubeMX is automatically invoked to allow users to perform graphical initialization configurations.
Why STM32CubeIDE not generating code?
There could be several reasons why STM32CubeIDE is not generating code:
- Ensure that STM32CubeMX is properly integrated and invoked during project creation.
- Check that you have properly configured the microcontroller and its peripherals in STM32CubeMX before attempting to generate the code.
- Verify the settings in the
Project > Propertiessection, particularly the code generation options. - Make sure there are no errors or missing configurations that may prevent code generation.

