We have introduced the hardware debugger tools / programmer before, now let us learn the ST-Link programmer together. In this article, you will learn about the different versions of ST-Link, their differences, and how to use them to program your chip.
ST-Link Version
Currently, there are three versions of ST-Link: ST-LINK/V1, ST-LINK/V2 and STLINK-V3. At the same time, the ST development board also comes with its own ST-Link tool, but its ST-Link version varies depending on the development board.
ST-LINK V1
ST-LINK V1 is the earliest version, and currently few people use it on the market.
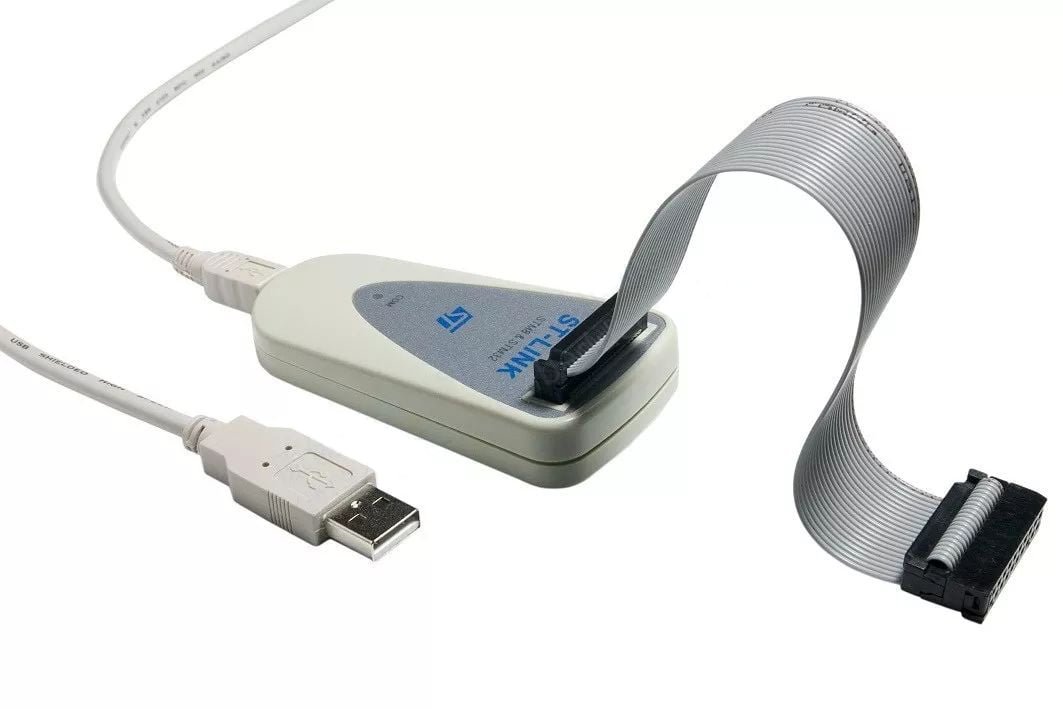
ST-LINK V2
The ST-LINK V2 version can be divided into two: ST-LINK/V2 (standard version) and ST-LINK/V2-ISOL (isolated version). Among them, ISOL (Isolation) comes with 1000V isolation. This version is relatively expensive.
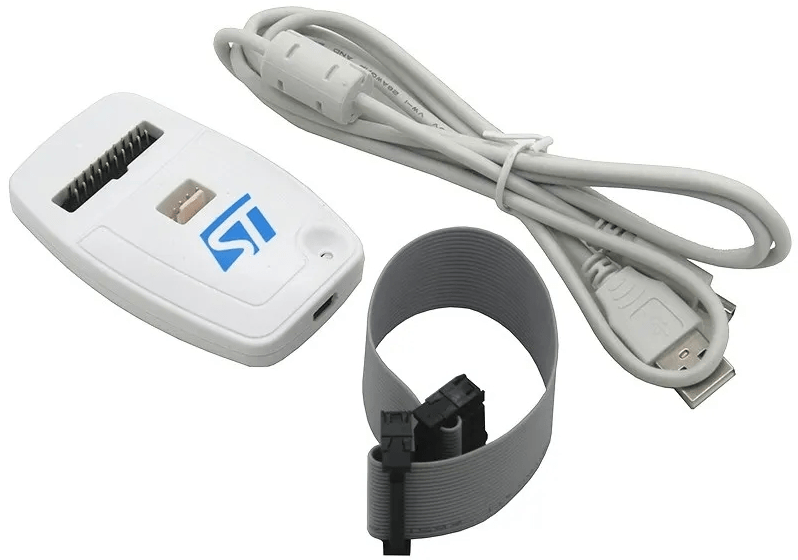
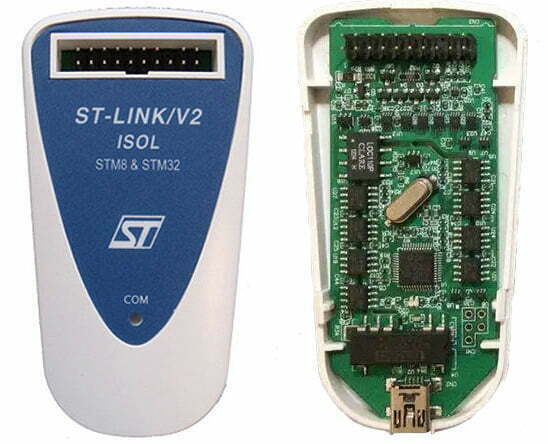
ST-LINK V3
STLINK-V3 also has multiple categories:
STLINK-V3SET
STLINK-V3SET is a set of fully functional download programming tools independent of the ST evaluation board, and is also a mainstream STLINK-V3 tool. It goes on sale for $35.
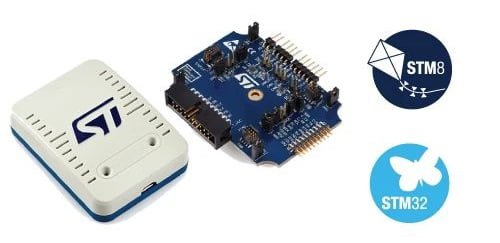
STLINK-3MINI
In 2019, ST launched the more compact and smaller STLINK-3MINI, measuring only 15 x 30mm, and its price when it went on sale was only $9.75.
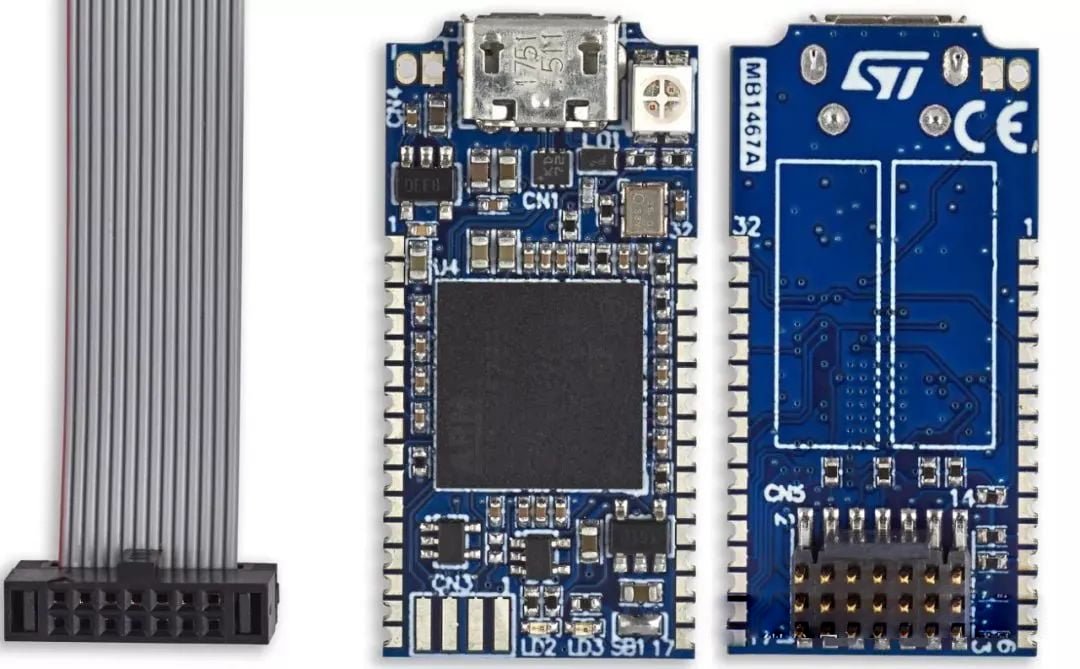
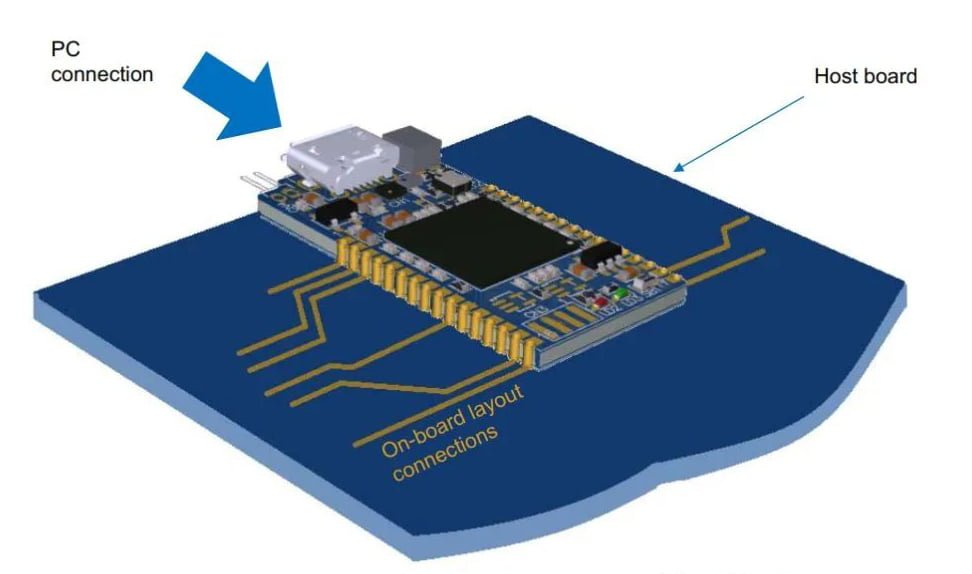
STLINK-V3MODS
The functions of STLINK-V3MODS and STLINK-V3MINI are basically the same, but the application scenarios are different. You can compare it to the “stamp version” of STLINK-V3MINI.
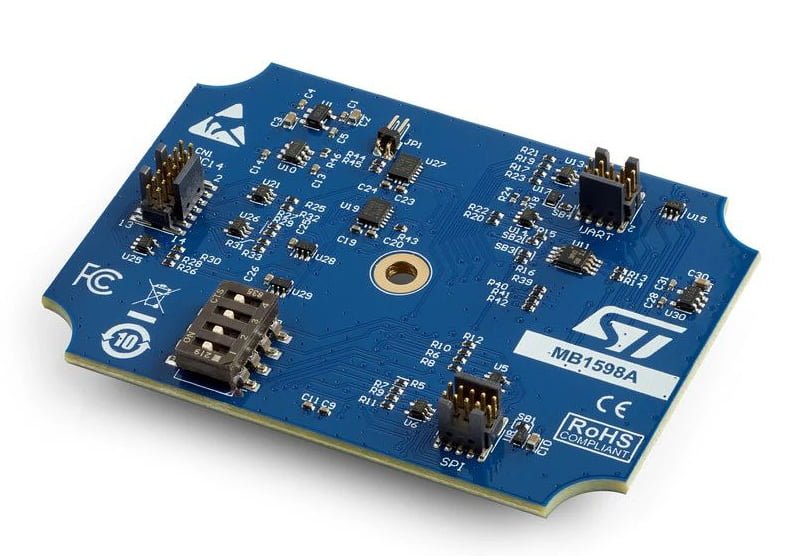
B-STLINK-VOLT
The B-STLINK-VOLT board is an add-on module/adapter board for STLINK-V3SET. It is more suitable for low-voltage (such as 1.8V) STM32 systems.
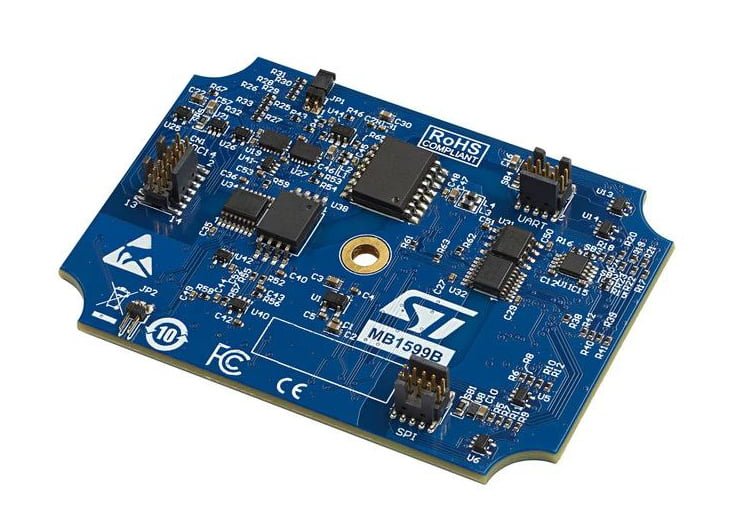
B-STLINK-ISOL
B-STLINK-ISOL is similar to B-STLINK-VOLT and is also an “expansion board” for STLINK-V3SET. It provides galvanic isolation and voltage conversion functions and is used with microcontrollers below 3.3 V.
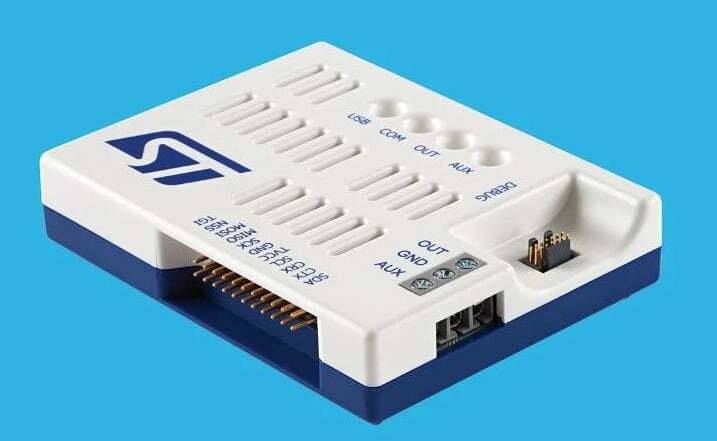
STLINK-V3PWR
STLINK-V3PWR, launched in March 2023, is an ST-Link hardware used to monitor and debug STM32 low-power current. The price at launch is $93.10.
Different Interfaces of ST-LINK
SWIM Interface
The SWIM interface is used to debug and download STM8. It has only four wires and is defined as follows:
| ST-LINK Port | STM8 Target Board | Function |
|---|---|---|
| VDD | MCU VCC | Connects to STM8's power supply VCC |
| DATA | MCU SWIM PIN | Connects to STM8's SWIM pin |
| GND | GND | Connects to STM8's GND |
| RESET | MCU RESET PIN | Connects to STM8's reset pin |
JTAG/SWD Interface
The ST-Link/V2 JTAG/SWD interface is defined as follows:
| Pin | ST-LINK Port | Target STM32 (JTAG) | Target STM32 (SWD) |
|---|---|---|---|
| 1 | TVCC | MCU VDD | MCU VDD |
| 2 | TVCC | MCU VDD | MCU VDD |
| 3 | TRST | JNTRST | GND |
| 4 | GND | GND | GND |
| 5 | TDI | JTDI | GND |
| 6 | GND | GND | GND |
| 7 | TMS_SWDIO | JTMS | SWDIO |
| 8 | GND | GND | GND |
| 9 | TCK_SWCLK | JTCK | SWCLK |
| 10 | GND | GND | GND |
| 11 | NC | NC | NC |
| 12 | GND | GND | GND |
| 13 | TDO_SWO | JTDO | TRACESWO (for SWV) |
| 14 | GND | GND | GND |
| 15 | NRST | NRST | NRST |
| 16 | GND | GND | GND |
| 17 | NC | NC | NC |
| 18 | GND | GND | GND |
| 19 | VDD | NC | NC |
| 20 | GND | GND | GND |
ST-LINK Programming Tool
One common feature of ST-LINK is that it is used for programming (downloading programs). Programming tools include: STVP, STM32 ST-LINK Utility, and STM32CubeProgrammer.
- STVP: A tool that can be used for both STM8 and 32 programming.
- ST-LINK Utility: A tool limited to STM32 programming.
- STM32CubeProg: A tool that can be used for both STM8 and 32 programming.
An Example of ST-LINK Programming with Keil 5
Here we introduce how to use st-link v2 in Keil 5 to download and debug programs for the arm development board. Including the wiring method of stlink, the configuration of stlink in keil, debugging in keil, etc.
Keil 5 Configuration
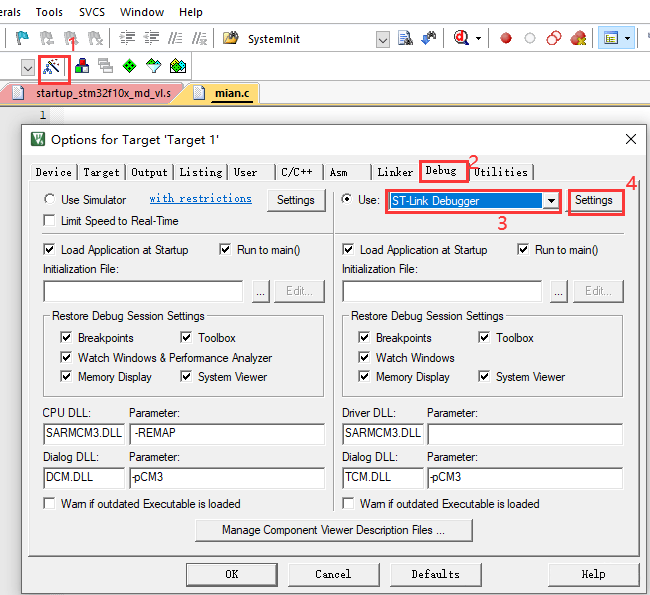
Click the magic wand in the Keil toolbar to bring up the configuration dialog box as shown below:
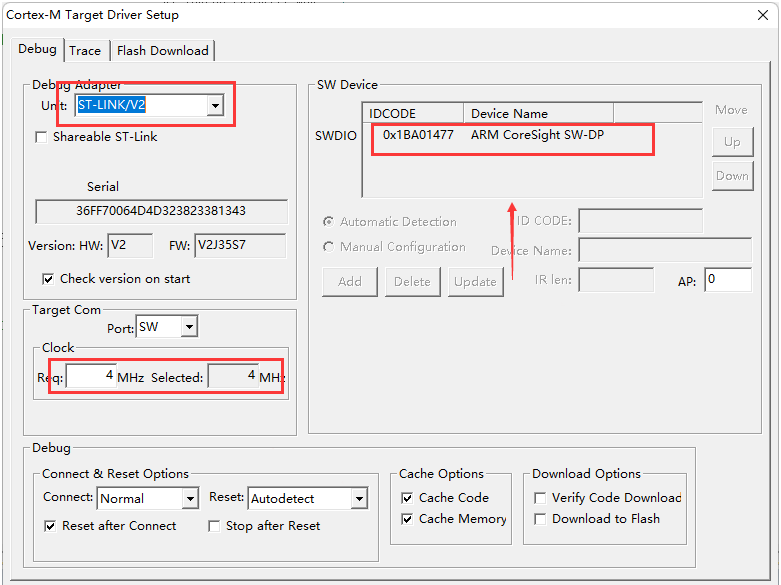
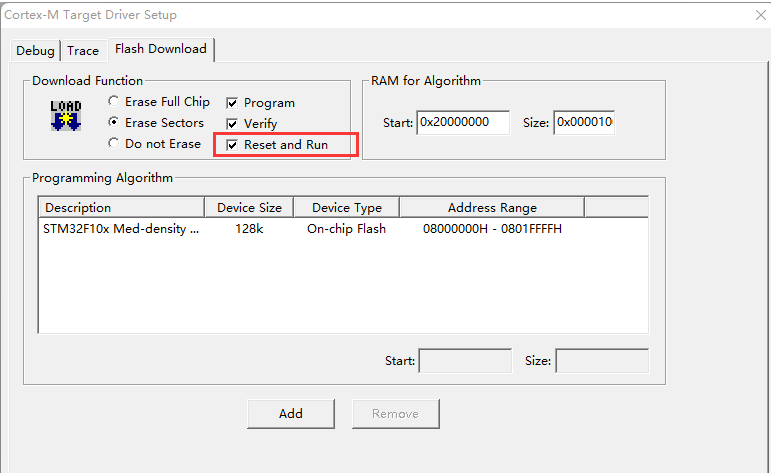
Check “Reset and Run”, the program will automatically reset and run after downloading to the microcontroller.
Debugging
Enter Debugging State
Click the button to enter or exit debug mode:

Common Debugging Operations
Reset
Reset the program to its initial position.

Single-step Debugging
It means that each time the button is clicked, the program runs one step. When encountering a calling function, it will enter the called function. Click the icon button, or press the shortcut key F11.

Step-by-step Debugging
It means line-by-line debugging, that is, each time the button is clicked, the program runs one line. When a function is encountered, it will not enter the function. Click the icon button, or press the shortcut key F10.

Jump out of Debugging
means jumping out of function debugging, that is, every time the button is clicked, the program jumps out of a function until the outermost function (main function) is jumped out. Click the icon button, or press the shortcut key Ctrl + F11.

Run the Program to the Specific Position
If you click the button (or Ctrl + F11), the program will stop when it reaches the cursor position (provided that the program can be executed to the cursor position).

Jump to the Pause Position of Keil's Program
This function is effective when the program stops running and can help us find the pause location of the program.

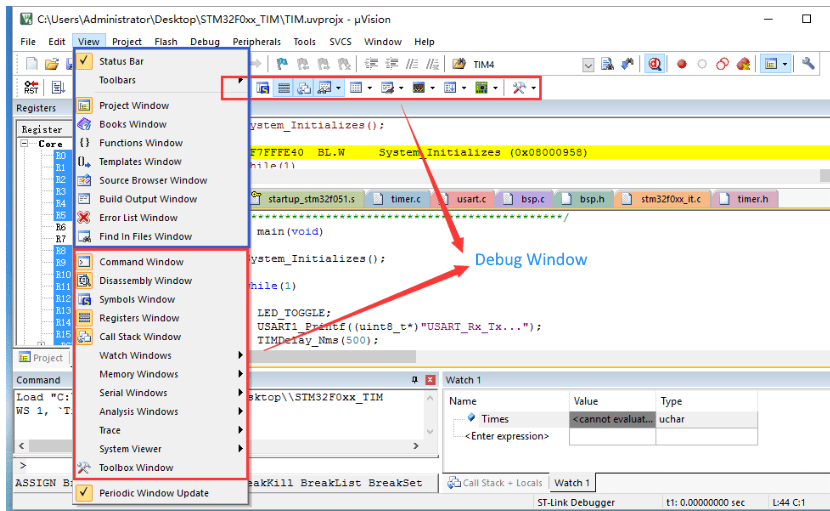
Debug Window
The menu of the debugging window is only activated during the debugging process, and is different from the window in the normal editing state.
Memory or Variable Window
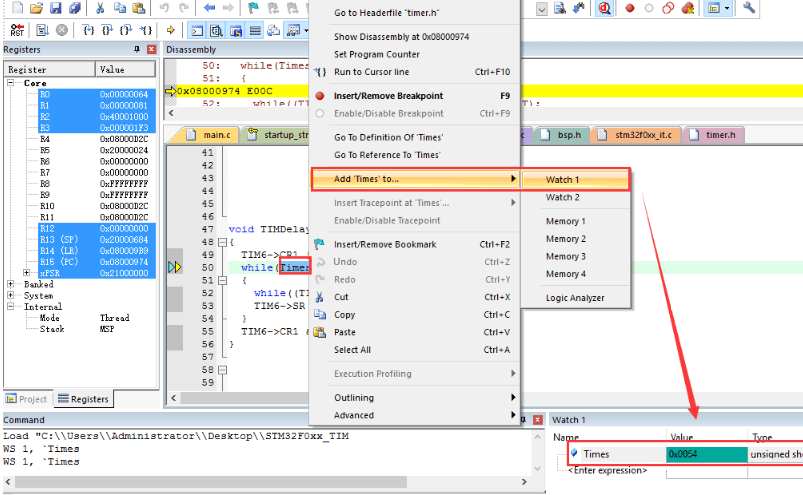
Select a variable, right-click the mouse and select “Add ‘Variable Name’ to…” to add it to the specified observation window.
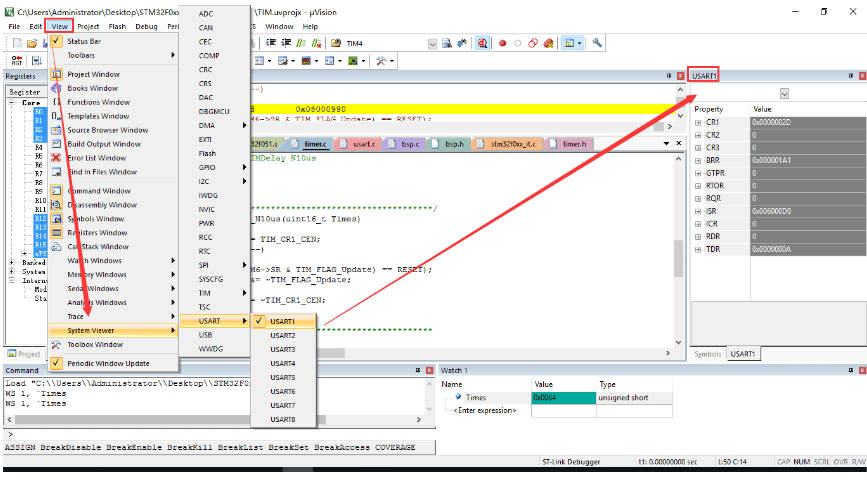
System Peripherals Window
That is, the peripheral register value viewing window.
