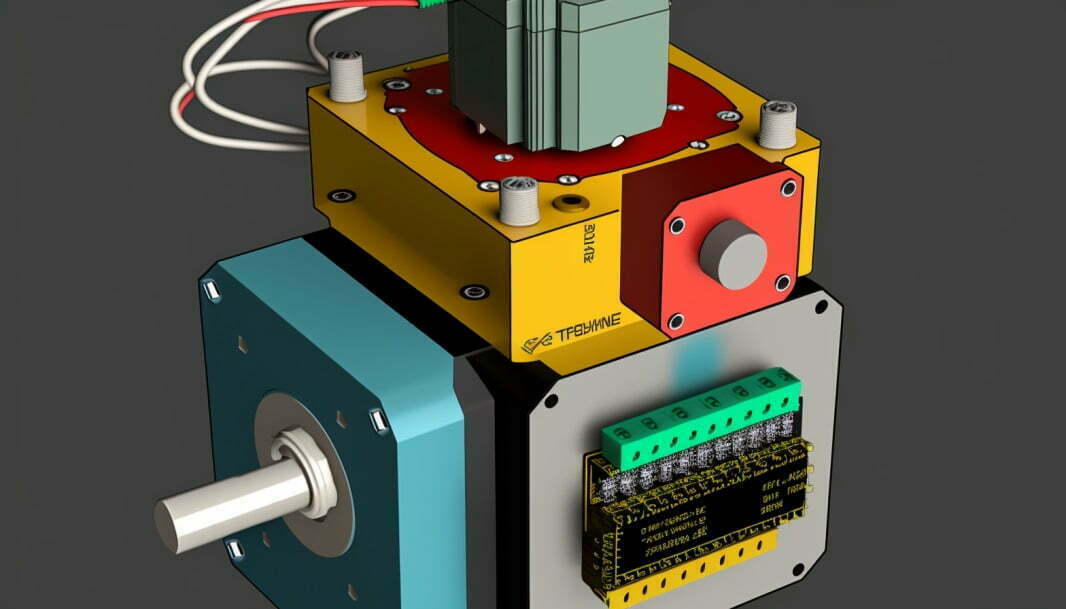
In embedded system development and MCU software development, engineers frequently employ debuggers to debug programs. Consequently, we can locate and reduce the number of errors in microcontroller programs, making them function as expected. Sometimes, debugging microcontroller programs can be challenging because even minor changes in one system module may lead to errors in another subsystem. Moreover, the debugging tools used in microcontroller development vary significantly in terms of development time and debugging capabilities. This article primarily introduces common types of debuggers for microcontrollers and how to use them.
What is a Hardware Debugger?
A hardware debugger is a tool that communicates with a microcontroller through a debugging interface, allowing it to run, pause, observe, and even modify the state of the process. In other words, a debugger is a device that translates commands sent by a PC (e.g., via USB protocol) into a language understood by the MCU (such as SWD or JTAG protocol), loads code, and precisely controls execution.
Types of Debuggers
Embedded software development relies heavily on debuggers and programmers, which help discover and fix program bugs, perform MCU programming, and more. Most semiconductor or chip manufacturers develop debuggers for their own MCUs to enhance their product ecosystems. As a result, there are various classifications available in the market, including J-Link debuggers, U-Link emulators, ST-LINK debuggers, and programmers.
J-Link
J-Link is a JTAG-based debugger introduced by the German company SEGGER. In simple terms, it is a JTAG protocol conversion box, a small USB-to-JTAG conversion box that connects to a computer via a USB interface and to the target board’s internals using the JTAG protocol. It performs the translation from software to hardware.

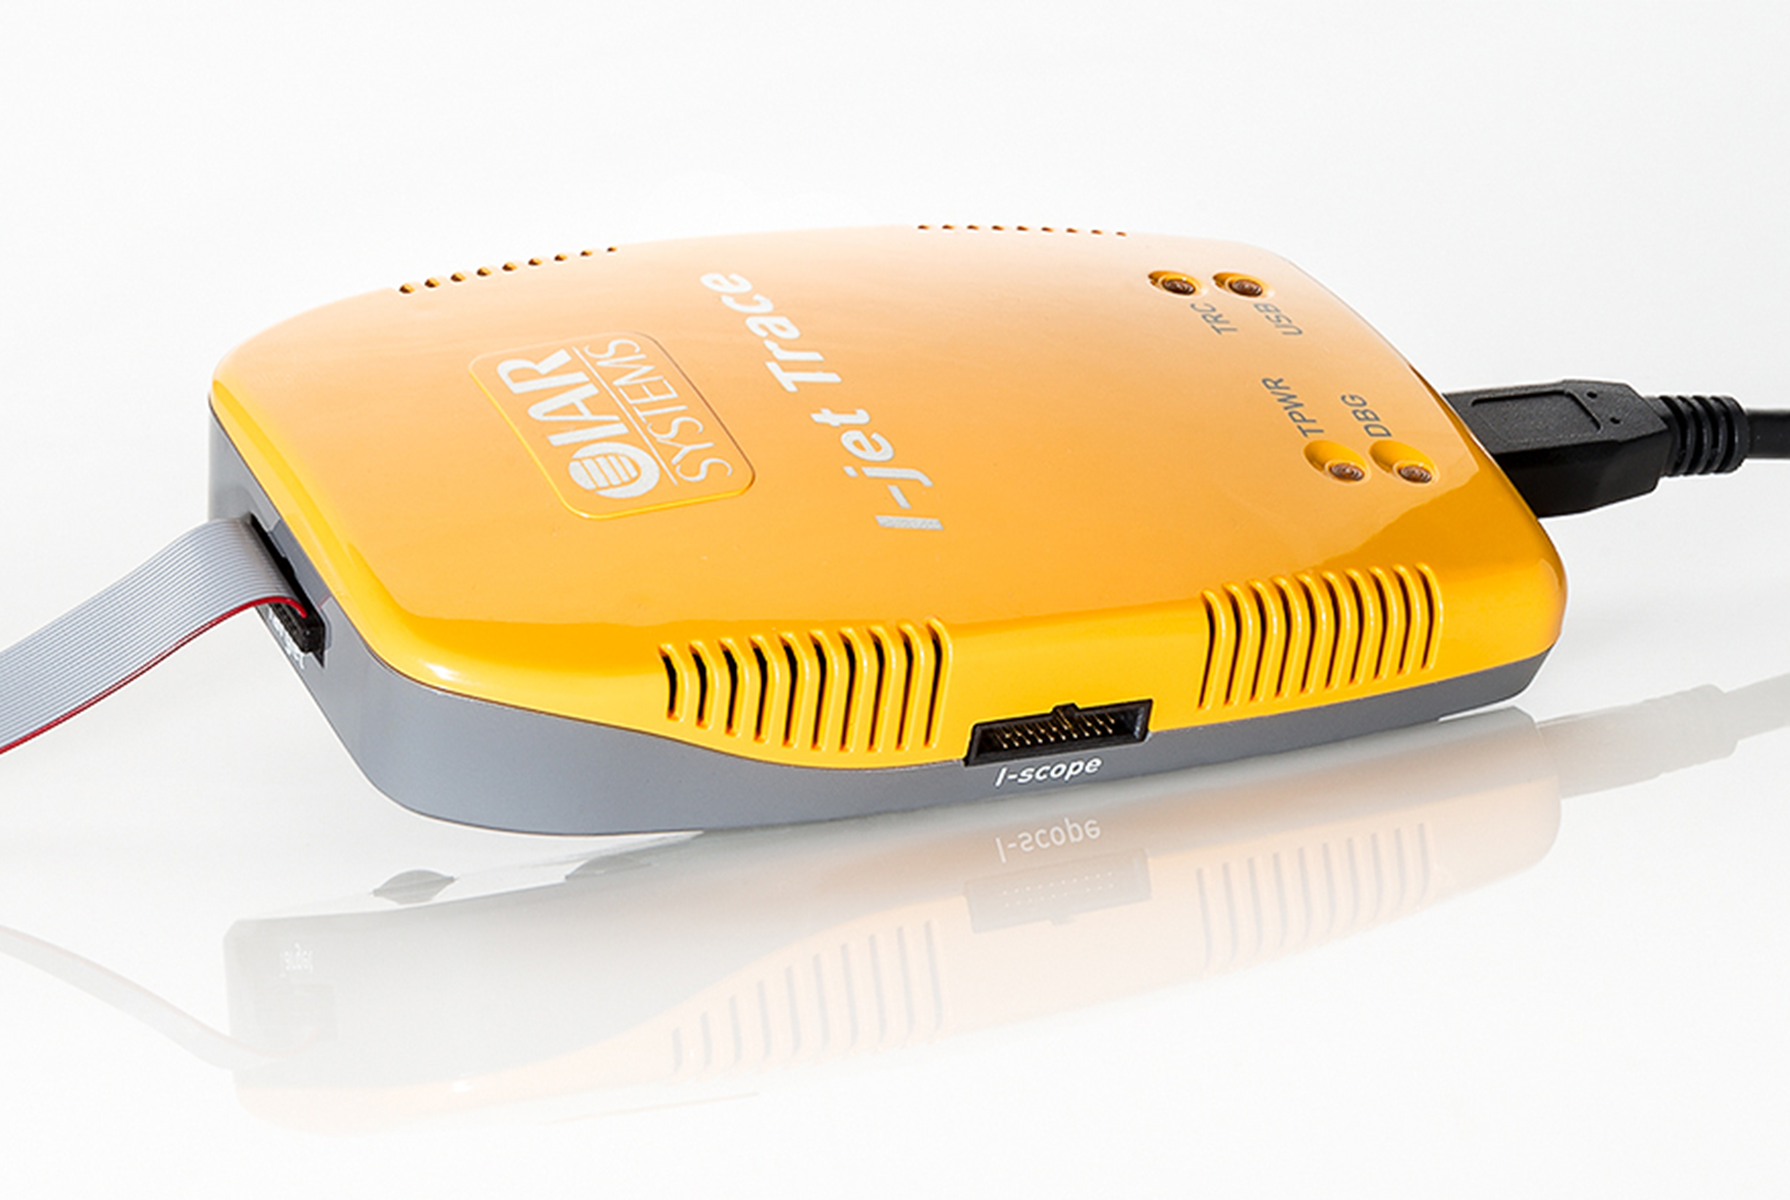
I-jet Trace
I-jet Trace, released by IAR Systems, is a powerful code debugging and tracing tool equipped with a large instruction cache and supporting USB 3.0 high-speed communication protocol. I-jet Trace supports all ARM Cortex-M series cores equipped with the Embedded Trace Macrocell (ETM) module, including the latest Cortex-M7 core. By tracing every executed instruction, ETM allows developers to deeply observe the MCU’s runtime behavior, uncovering significant bugs that may be difficult to discover with typical debugging methods.
U-LINK
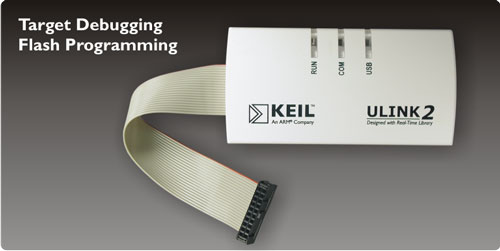
ULINK is a debugger / emulator introduced by ARM/KEIL. Currently, upgraded versions like ULINK2 and ULINK Pro emulators are available. ULINK/ULINK2 can be used with Keil software to enable emulation functions and are primarily compatible with Keil software. They provide support for serial wire debug (SWD), return clock support, real-time trace, and other features. Development engineers can conveniently perform on-chip debugging (using on-chip JTAG, SWD, and OCDS) and flash programming when using RealView MDK’s debugger in combination with ULINK2.
CMSIS-DAP
CMSIS-DAP can be dissected into two parts: CMSIS and DAP. CMSIS stands for ARM Cortex-M Software Interface Standard, while DAP stands for Debug Access Port. CMSIS-DAP is a firmware implementation of a USB debugger device unit. Debugging software running on the host computer communicates with the debugger device through a USB interface, ultimately enabling debugging of application software running on the target MCU. The CMSIS-DAP debugger connects to the target device via JTAG or SWD. ARM Cortex processors provide Core Sight Debug and Trace units. CMSIS-DAP debuggers can support processors containing one or more ARM cores.
DAPLink
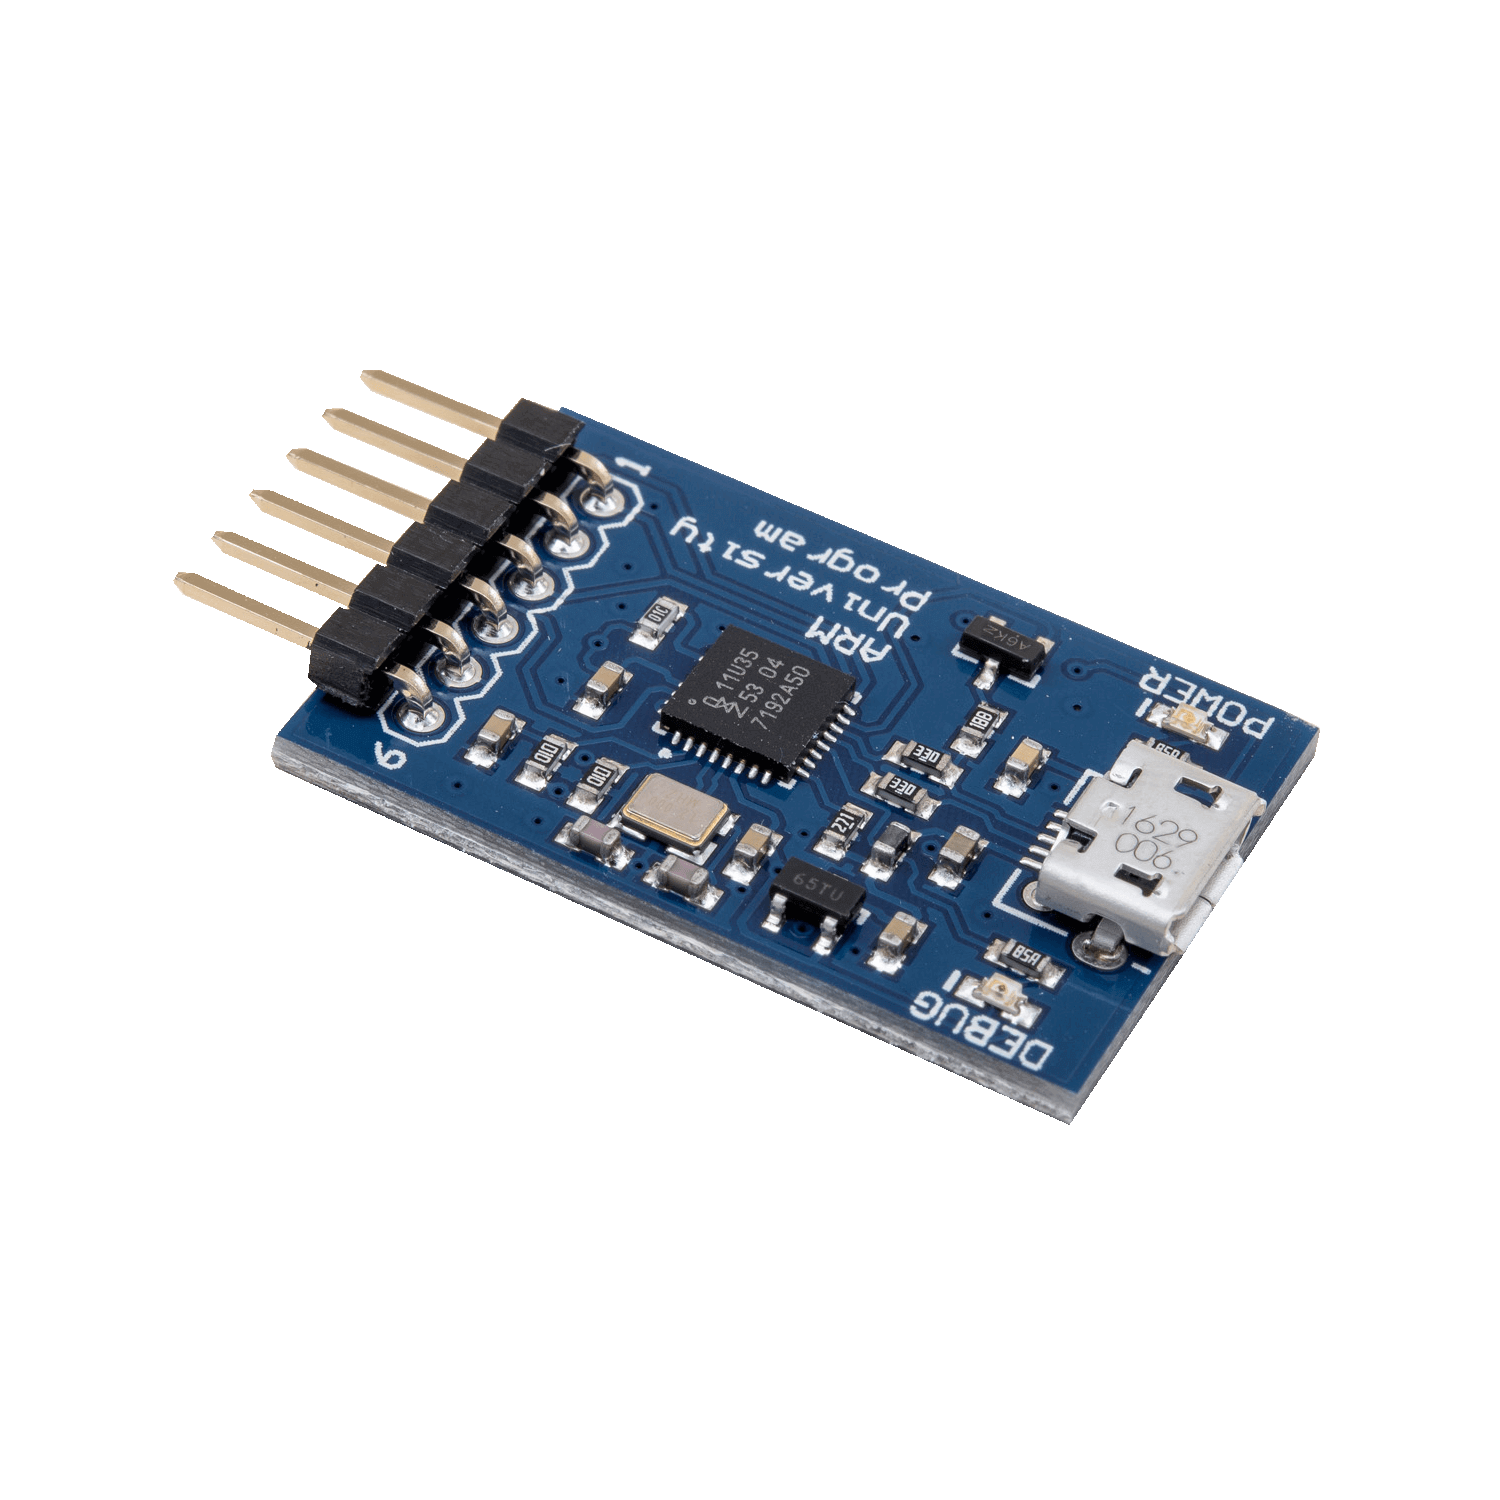
DAPLink is an open-source emulator officially developed by ARM, capable of program downloading and debugging for a full range of Cortex-M0/M3/M4/M7 core chips.

ICD Debugger
ICD (In-Circuit Debugger), often simply referred to as an “ICD debugger,” is a hardware debugging tool used in embedded systems development. It enables developers to perform real-time debugging of microcontrollers or other embedded devices while they are operating within the target circuit (in-circuit).
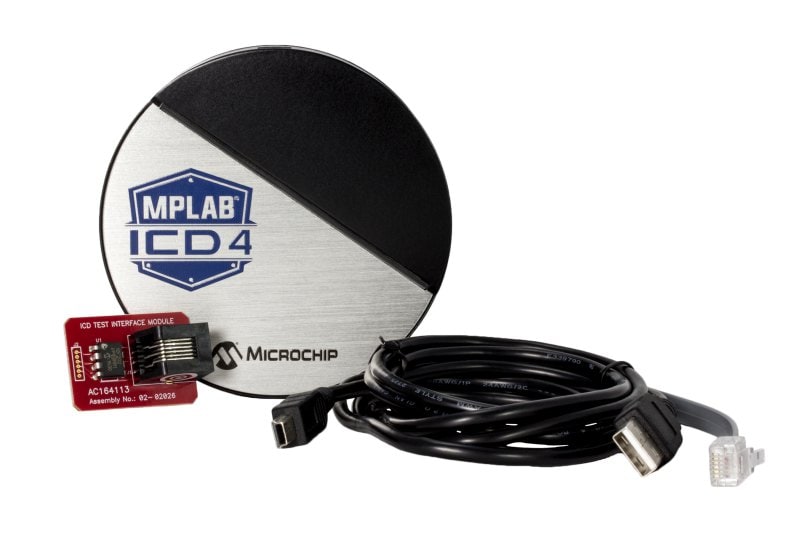
ICD debuggers typically connect to the target device through its debugging interface, such as JTAG (Joint Test Action Group) or SWD (Serial Wire Debug). These debuggers offer a range of essential debugging features, including setting breakpoints, single-stepping through code, inspecting variable values, and monitoring the execution flow of a program.
One of the key advantages of ICD debuggers is their ability to debug software in its actual hardware context, allowing developers to identify and fix issues that may only occur when the target device is running within its intended environment.
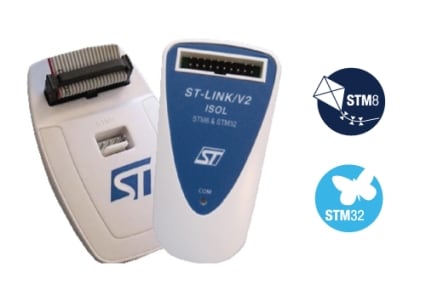
ST-Link is a dedicated online debugger and programmer for STM8 and STM32 microcontrollers, often referred to as a downloader. ST-Link features communication interfaces such as SWIM, JTAG, and SWD for communication with STM8 or STM32 microcontrollers (various versions available).
MCU-Link
MCU-Link, developed jointly by NXP and Embedded Artist, is a powerful and cost-effective debugger that seamlessly integrates with MCUXpresso IDE. It is also compatible with third-party IDEs that support the CMSIS-DAP protocol, such as the commonly used MDK Keil and IAR Embedded Workbench.
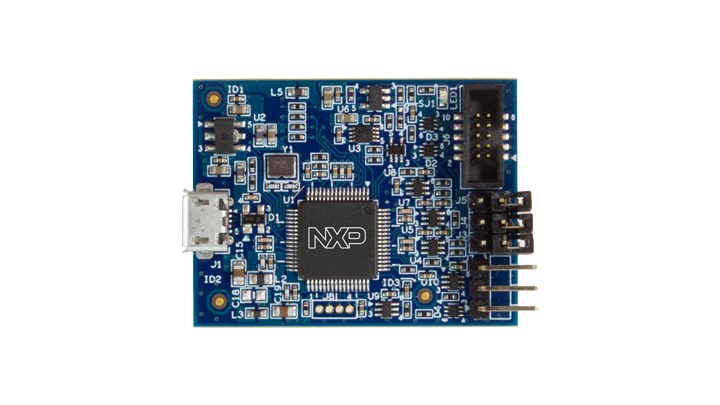
MCU-Link is based on the LPC55S69 microcontroller, featuring a high-speed USB interface for high-performance debugging. The LPC55S69 is a dual-core Cortex-M33 microcontroller with a clock speed of up to 150 MHz. It includes USB-to-serial (VCOM) functionality, allowing developers to output MCU-side data to the PC during debugging.
OpenSDA
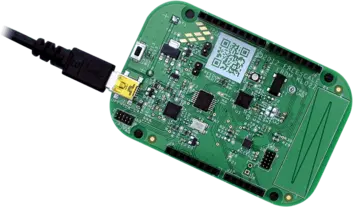
OpenSDA is an onboard hardware debugging circuit that combines debugging, USB-to-serial conversion, and drag-and-drop firmware features. It is present on almost all NXP and Freescale official development boards. OpenSDA is favored by users for its simplicity, low cost, powerful functionality, and widespread availability.
Nu-Link
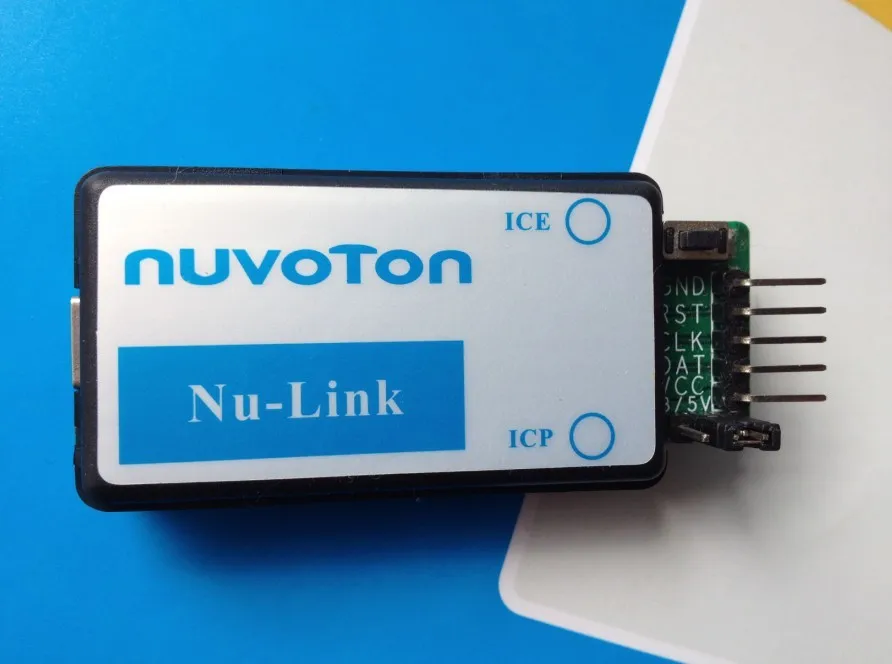
Nu-Link is a debugging and programming tool developed by Nuvoton, offering debugging and online/offline programming capabilities. The tool includes a USB port that connects to the host computer, LED status indicators, an offline programming button, and an SWD interface for connecting to the target chip for debugging and programming (SWD port operates at a default voltage of 5V).
How Debuggers Work?
The principle of microcontroller debugging involves communication between the debugging tool and the microcontroller, facilitating debugging of the microcontroller program. Breakpoints are commonly used debugging techniques to pinpoint bugs in the code.
Setting Breakpoint Conditions
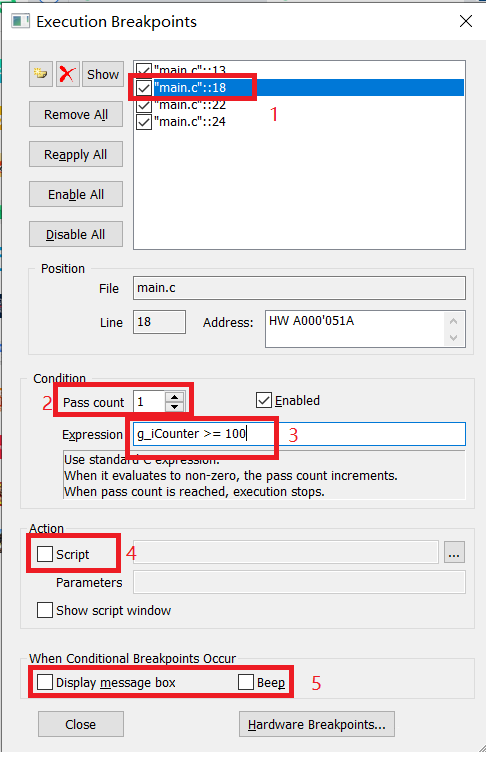
In the figure above, there is a list of breakpoints, totaling four breakpoints. Any breakpoint can be assigned conditions, as shown in the red box 1.
You can specify the number of times a breakpoint is effective, i.e., how many times it triggers when reaching that position, as seen in red box 2. In this example, it is set to trigger once.
You can set an evaluation expression, as indicated in the red box 3 of the figure. For example, the breakpoint will trigger when “g_iCounter” is greater than or equal to 100. Conditions like this are combined with the condition in red box 2 using a logical “AND” relationship. Both conditions must be satisfied for the breakpoint to trigger; otherwise, the code continues to run.
When the breakpoint triggers, you can execute a Python script, as shown in red box 4 of the figure.
You can also display a message box and/or sound a buzzer to provide alerts when the breakpoint triggers.
Setting Breakpoint Triggers
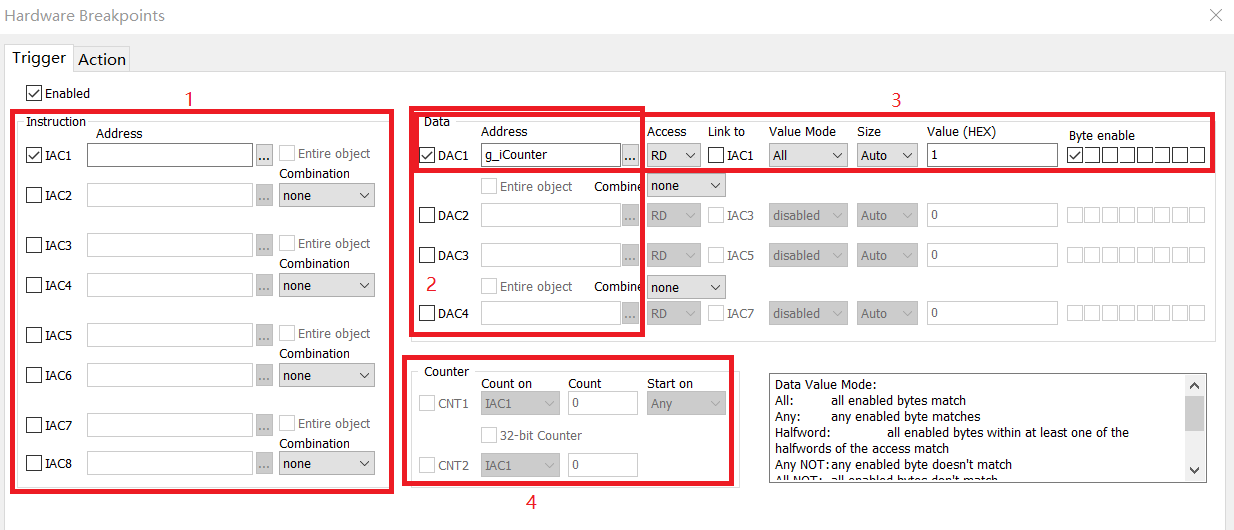
Breakpoint triggers are similar to pre-defined triggers that cause the code to halt when certain conditions are met during execution. The triggering location may not be known in advance.
In the figure, red box 1 represents an instruction trigger, which stops the code at a specific line, similar to setting a breakpoint directly in the code.
Red box 2 represents a data trigger, which stops the code when there is a read/write operation on a particular variable or address, and it can monitor whether a specific bit is set or cleared (availability depends on the microcontroller). The code halts at the corresponding position.
Red box 3 is an example where “g_iCounter” is selected. When its highest bit is set to 1, it triggers the breakpoint. Otherwise, the code continues to run.
Red box 4 illustrates a complex triggering condition involving multiple conditions, which also depends on the microcontroller’s capabilities.
Conclusion
In summary, hardware debuggers and their various types play a crucial role in embedded system development by enabling developers to locate and rectify software bugs, perform real-time debugging, and gain insights into the execution of microcontroller programs. These tools provide essential features like breakpoints, triggering conditions, and the ability to execute scripts, making the debugging process more efficient and effective.


