What is signal to noise ratio?
The signal-to-noise ratio (SNR) is a measure used in science and engineering that compares the level of a desired signal to the level of background noise. It is defined as the ratio of signal power to the noise power. A ratio higher than 1:1 indicates more signal than noise.
How to calculate signal to noise ratio?
The SNR is usually expressed in decibels (dB). The signal to noise ratio formula is:
SNR=10lg(Ps/Pn)
or
SNR=20lg(Vs/Vn)
Among them, “Ps” and “Pn” represent the effective power of signal and noise respectively, and “Vs” and “Vn” are the effective values of signal and noise voltage.
Simulation calculation
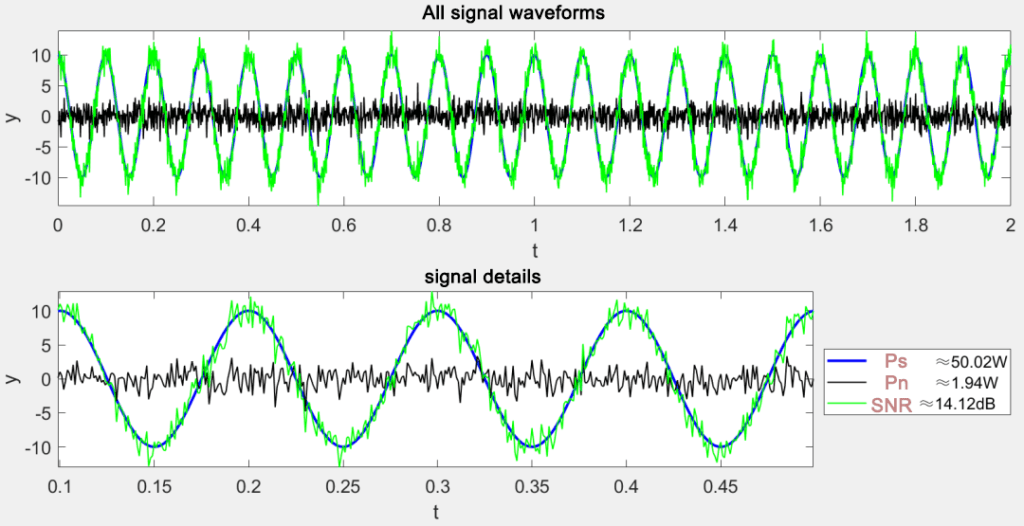
The following case will use the power ratio as an example to carry out simulation calculations:
					%% Calculating the SNR Simulation
clear; clc; close all; warning off;

% parameter settings
T = 2; % Simulation time
fs = 1000; % Sampling frequency
t = 0 : 1/fs : T;
L = length(t);
A = 10; % Amplitude
fc = 10; % carrier frequency
P_n = 2; % noise power

% generate simulated signal
signal = A * cos(2 * pi * fc .* t); % generate a valid signal
noise = sqrt(P_n) .* randn(1, L); % Generate white Gaussian noise signal

% Calculating SNR
P_s = sum(signal .^ 2) / L; % signal power
P_n = sum(noise .^ 2) / L; % noise power
SNR = 10 * log10(P_s / P_n); % signal-to-noise ratio
fprintf('\t Ps:%.2fW\n', P_s);
fprintf('\t Pn:%.2fW\n', P_n);
fprintf('\t SNR:%.2fdB\n', SNR);

figure(1); clf;
subplot(2, 1, 1);
plot(t, signal, 'b', 'linewidth', 2); hold on;
plot(t, noise, 'k', 'linewidth', 1); hold on;
plot(t, signal+noise, 'g', 'linewidth', 1);
xlabel('t'); ylabel('y'); axis('tight'); title('All waveforms'); set(gca, 'fontsize', 14);
subplot(2, 1, 2);
plot(t(100:500), signal(100:500), 'b', 'linewidth', 2); hold on;
plot(t(100:500), noise(100:500), 'k', 'linewidth', 1); hold on;
plot(t(100:500), signal(100:500)+noise(100:500), 'g', 'linewidth', 1);
legend(['signal power≈', num2str(P_s, '%.2f'), 'W'], ['noise power≈', num2str(P_n, '%.2f'), 'W'], ...
['SNR≈', num2str(SNR, '%.2f'), 'dB'], 'location', 'eastoutside');
xlabel('t'); ylabel('y'); axis('tight'); title('Zoom in to observe signal details'); set(gca, 'fontsize', 14);
set(gcf, 'position', [12, 60, 1450, 650]);
ADC SNR
ADC SNR is used to measure the quality of a digital-to-analog converter (DAC) or analog-to-digital converter (ADC). The higher the ADC SNR value, the better the performance of the converter system. It is essential for any signal system to maintain a good ADC SNR value in order to provide accurate output signals.
ADC SNR calculation
adc snr formula:
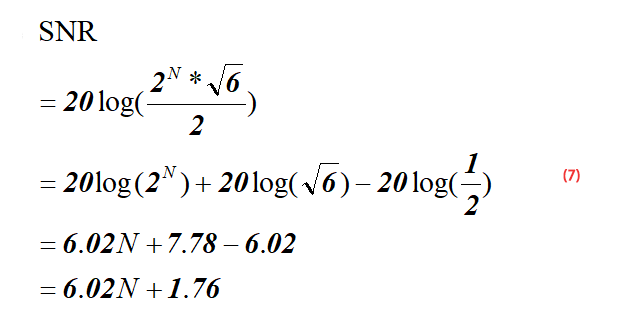
SNR=6.02N+1.76dB
“N” is the number of bits of the ADC.
Formula Derivation
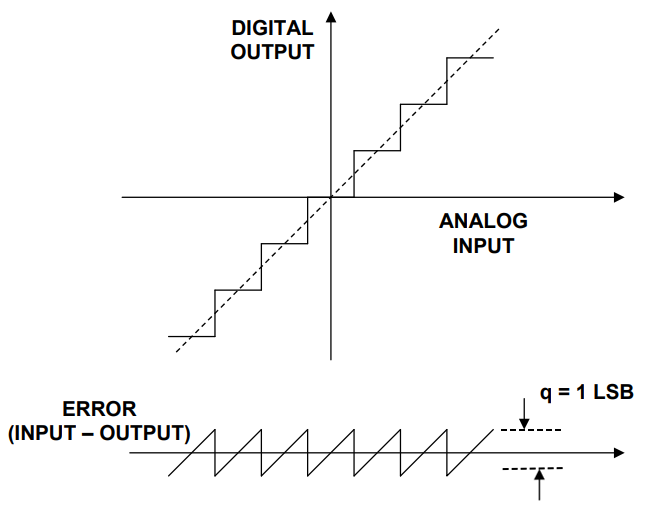
The figure below is a schematic diagram of the quantization noise of an ideal ADC. As can be seen from the figure below, for a linear input analog signal, the ADC will produce a stepped output. The error waveform of this input and output is similar to a sawtooth with peak-to-peak value q=1LSB Wave, its effective value RMS calculation process is shown in formula (1) (q=1LSB), LSB calculation process is shown in formula (2), where FS is the input voltage range of ADC.
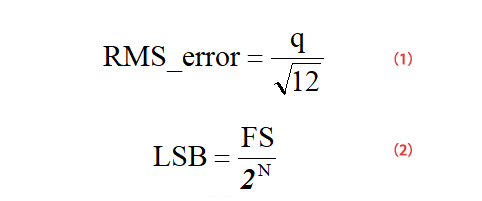
Since the signal-to-noise ratio is the effective value (RMS) of the signal divided by the effective value (RMS) of the noise, we can get the formula (3):

For a full-scale input sinusoidal signal as shown in formula (4), formula (5) can be obtained according to formula (4):
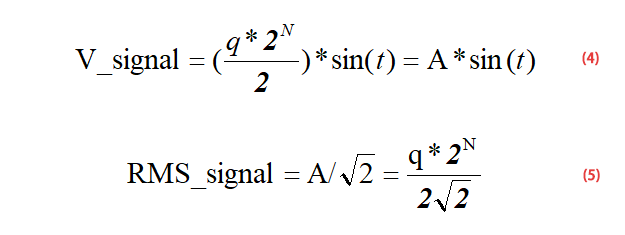
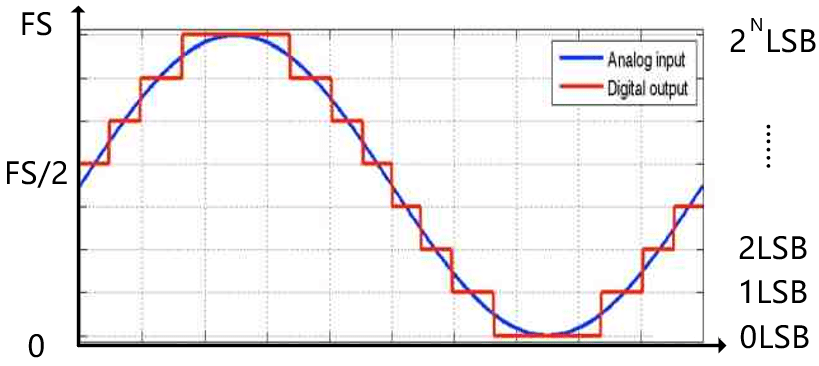
For a full-scale ADC, its input range is 0-FS, then the amplitude range of the input sinusoidal signal is 0-Fs/2, see the schematic diagram below, so the denominator in formula (4) is 2.
So far, we know the effective value (RMS) of the signal – formula (5), and the effective value (RMS) of the ADC quantization noise – formula (1). Now we put the formula (5) and formula (1) into formula (3) to get formula (6):
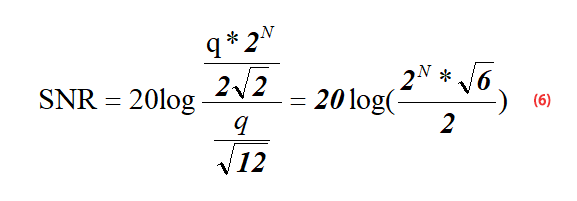
After simplifying the formula (6), we can obtain formula 7 as below:
